Visualization of the historical data collected by students helps us quickly understand how a given product of practice changes over time and in relation to external (social and technological) and internal (disciplinary and professional) variables, like changing body parts with a single mind and heart.
The translation of the collective research framework into information visualization serves several purposes: It acts as a forcing function to balance deep individual research with collective and holistic understanding of the history of practice. It also serves as an underlying analogue for the examination of collective design methods, individual authorship, and new forms of human and non-human collaboration emerging in 21st century design practice. Images captured on this page are snapshots of visualization tests and explorations; they serve to document our research process and highlight essential variables and inflection points in the evolution of architectural instrumentation.
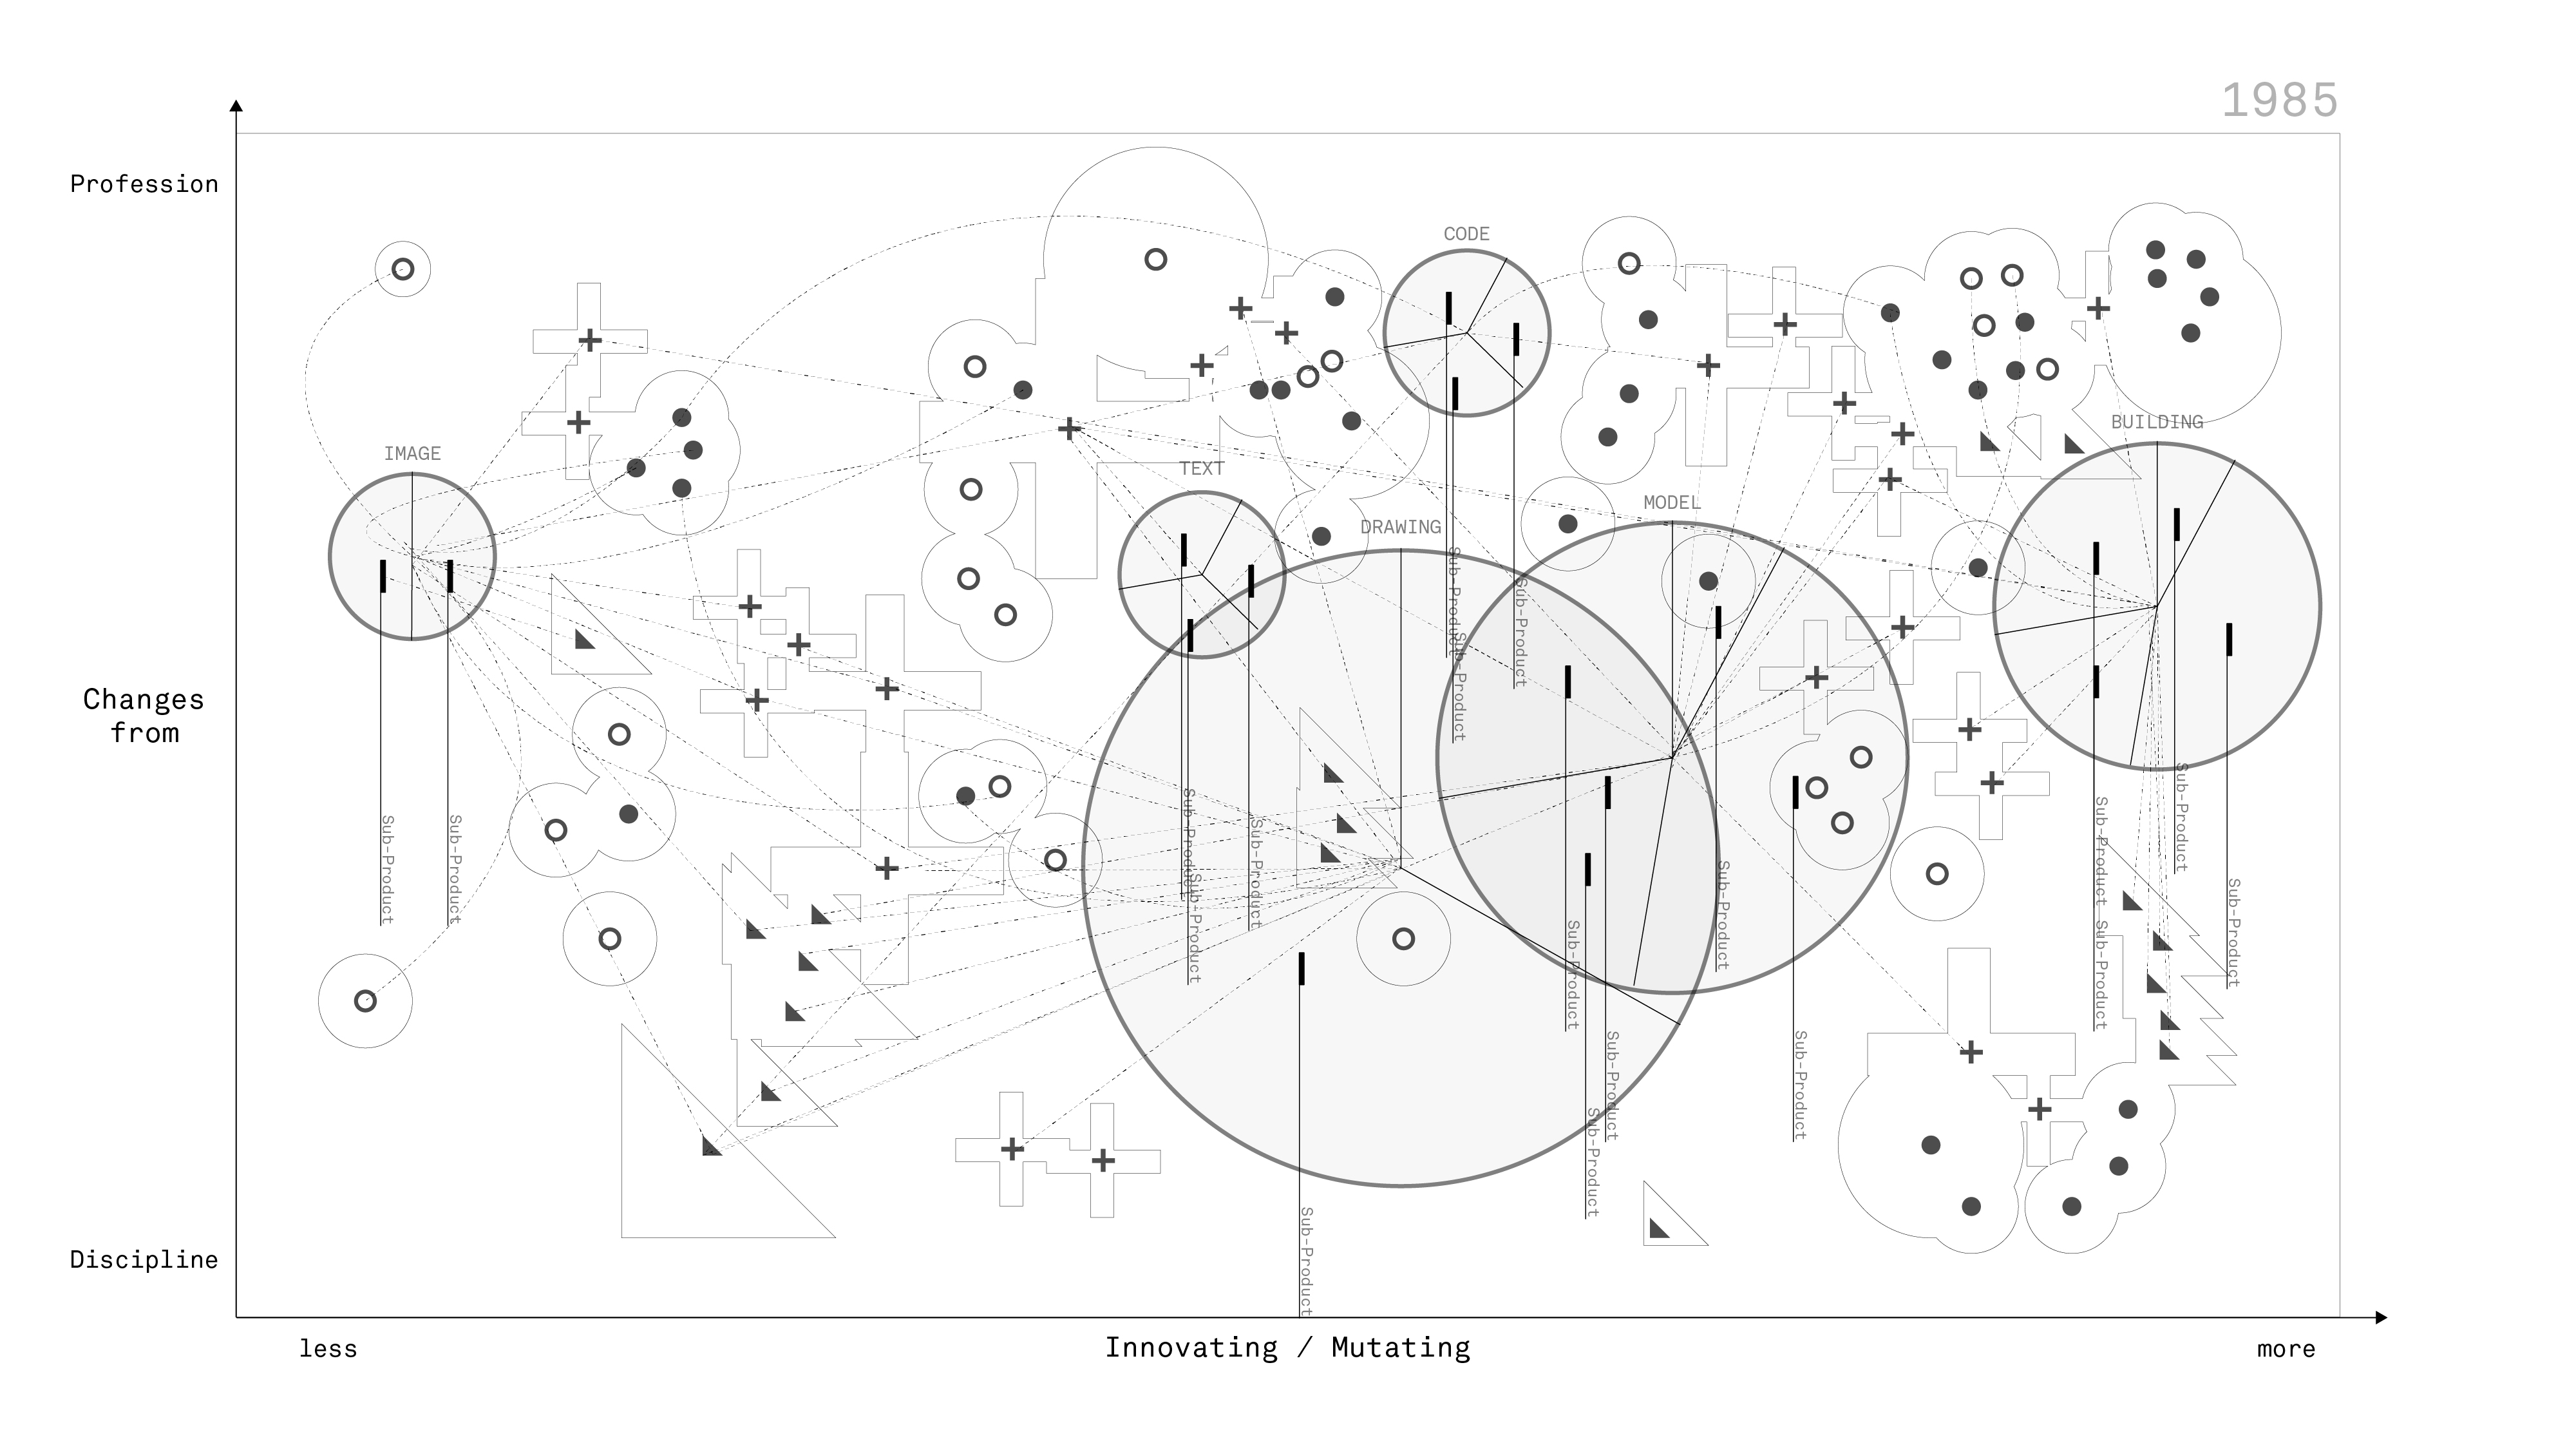
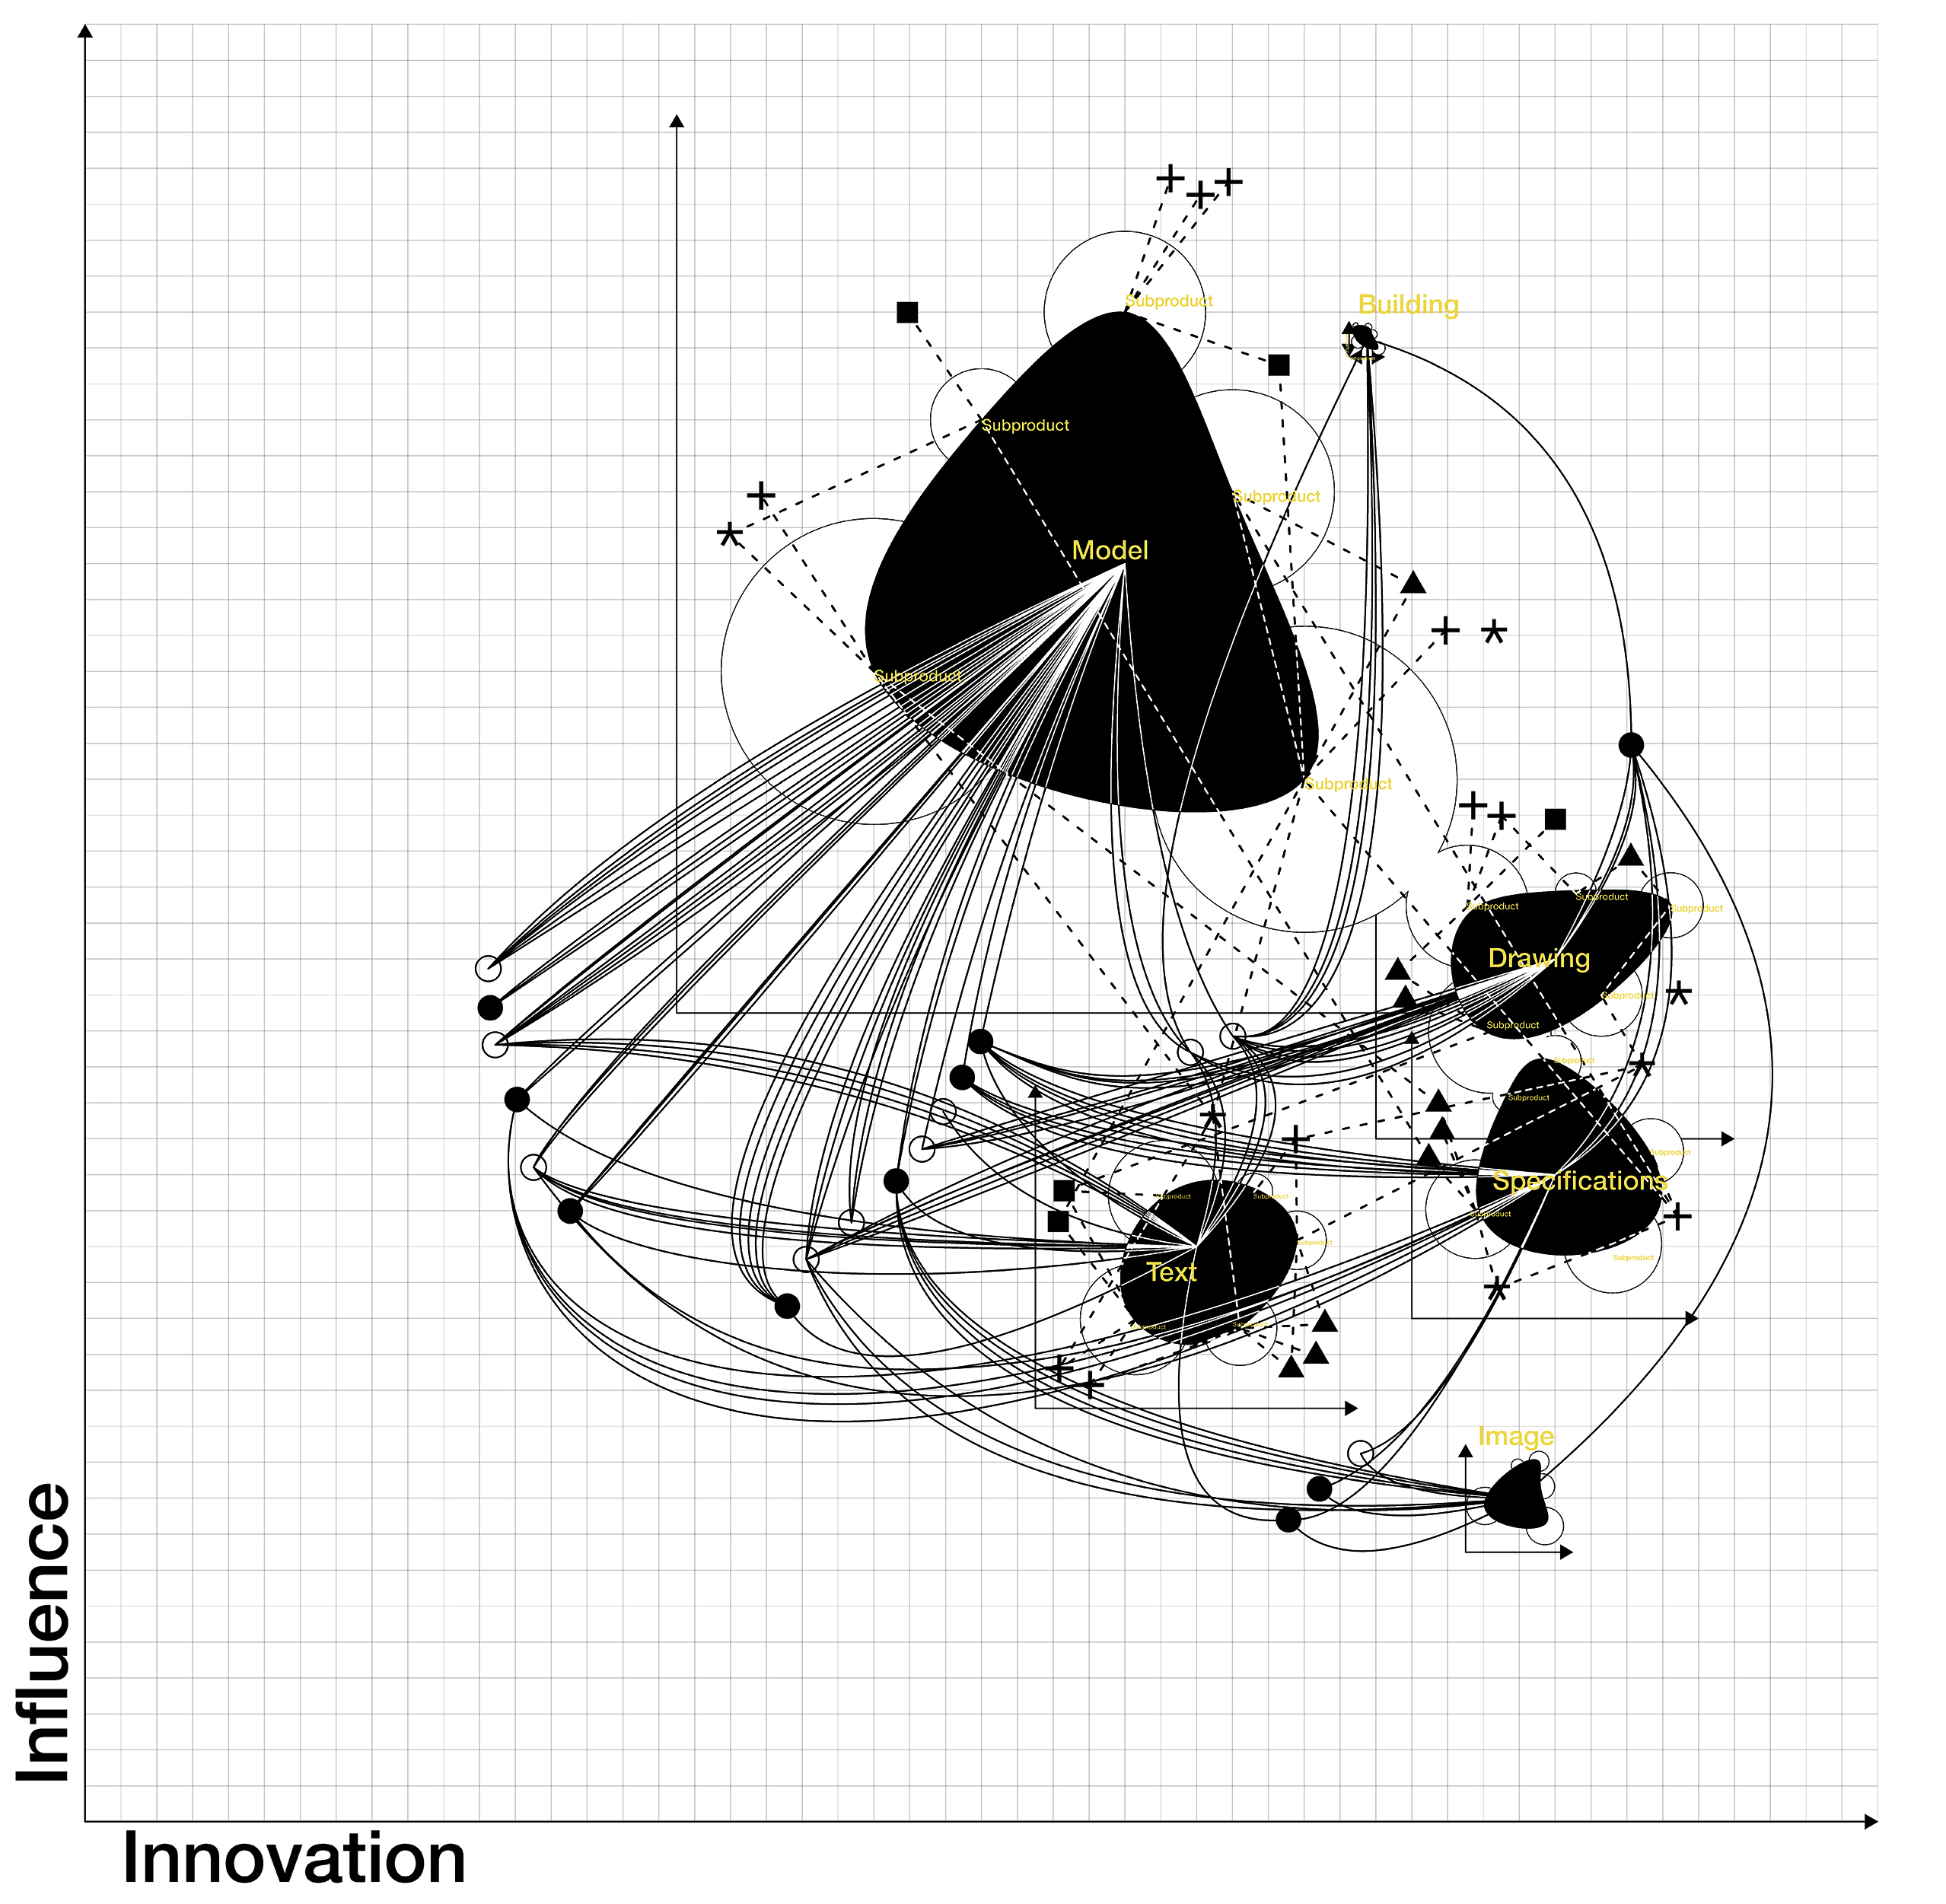
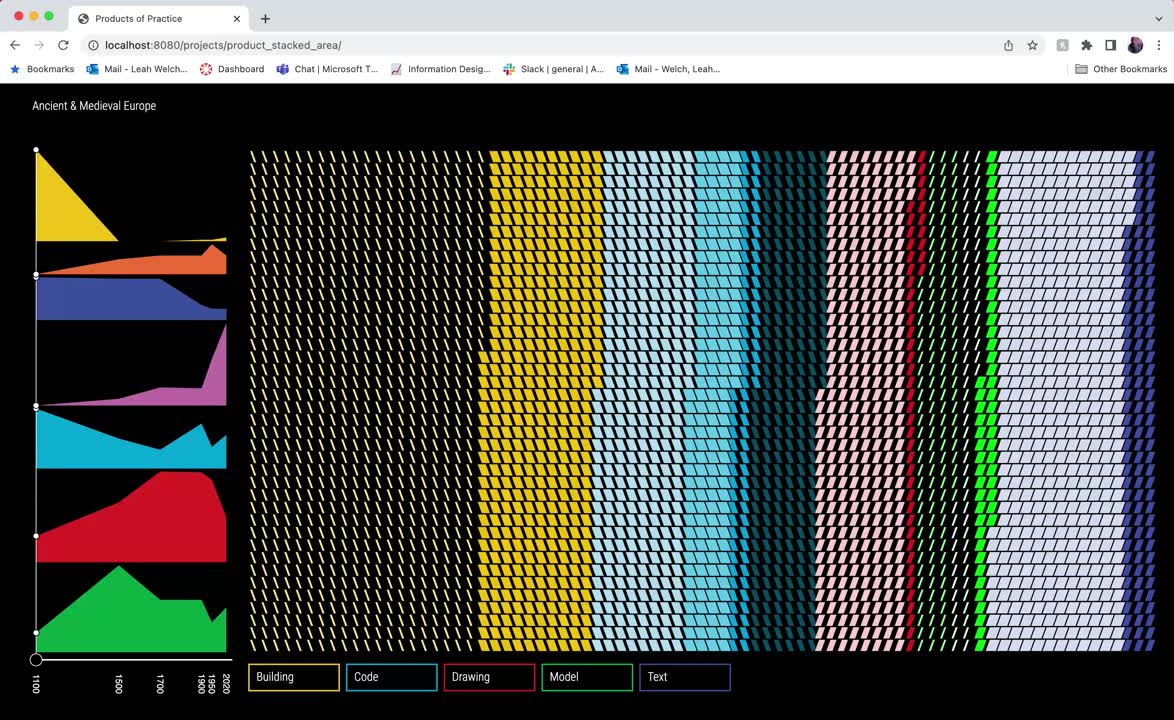
In the first year of the studio, students considered and visualized the influence a given mode of instrumentation had upon society across time, and in relationship to the innovation that it displays as a native or novel form of representation within our field. A design for an interactive data visualization translates this concept into an explorable chronology of products and their sub-products as they wax and wane in importance. The interactive application hybridized the collective diagram and the product-based fingerprints to demonstrate how the “DNA sequence” of practice evolves over time.
In subsequent years of the course, students tested two complimentary modes of information collection: a single visualization of the “body” of practice and individual “fingerprints” of each product. This addition of the fingerprint visualization helped students to address a single mode of architectural instrumentation by defining and refining its sub-products as they wax and wane in response to inflection points such as the invention of computer aided design, significant shifts in regulation, or threshold cultural moments.
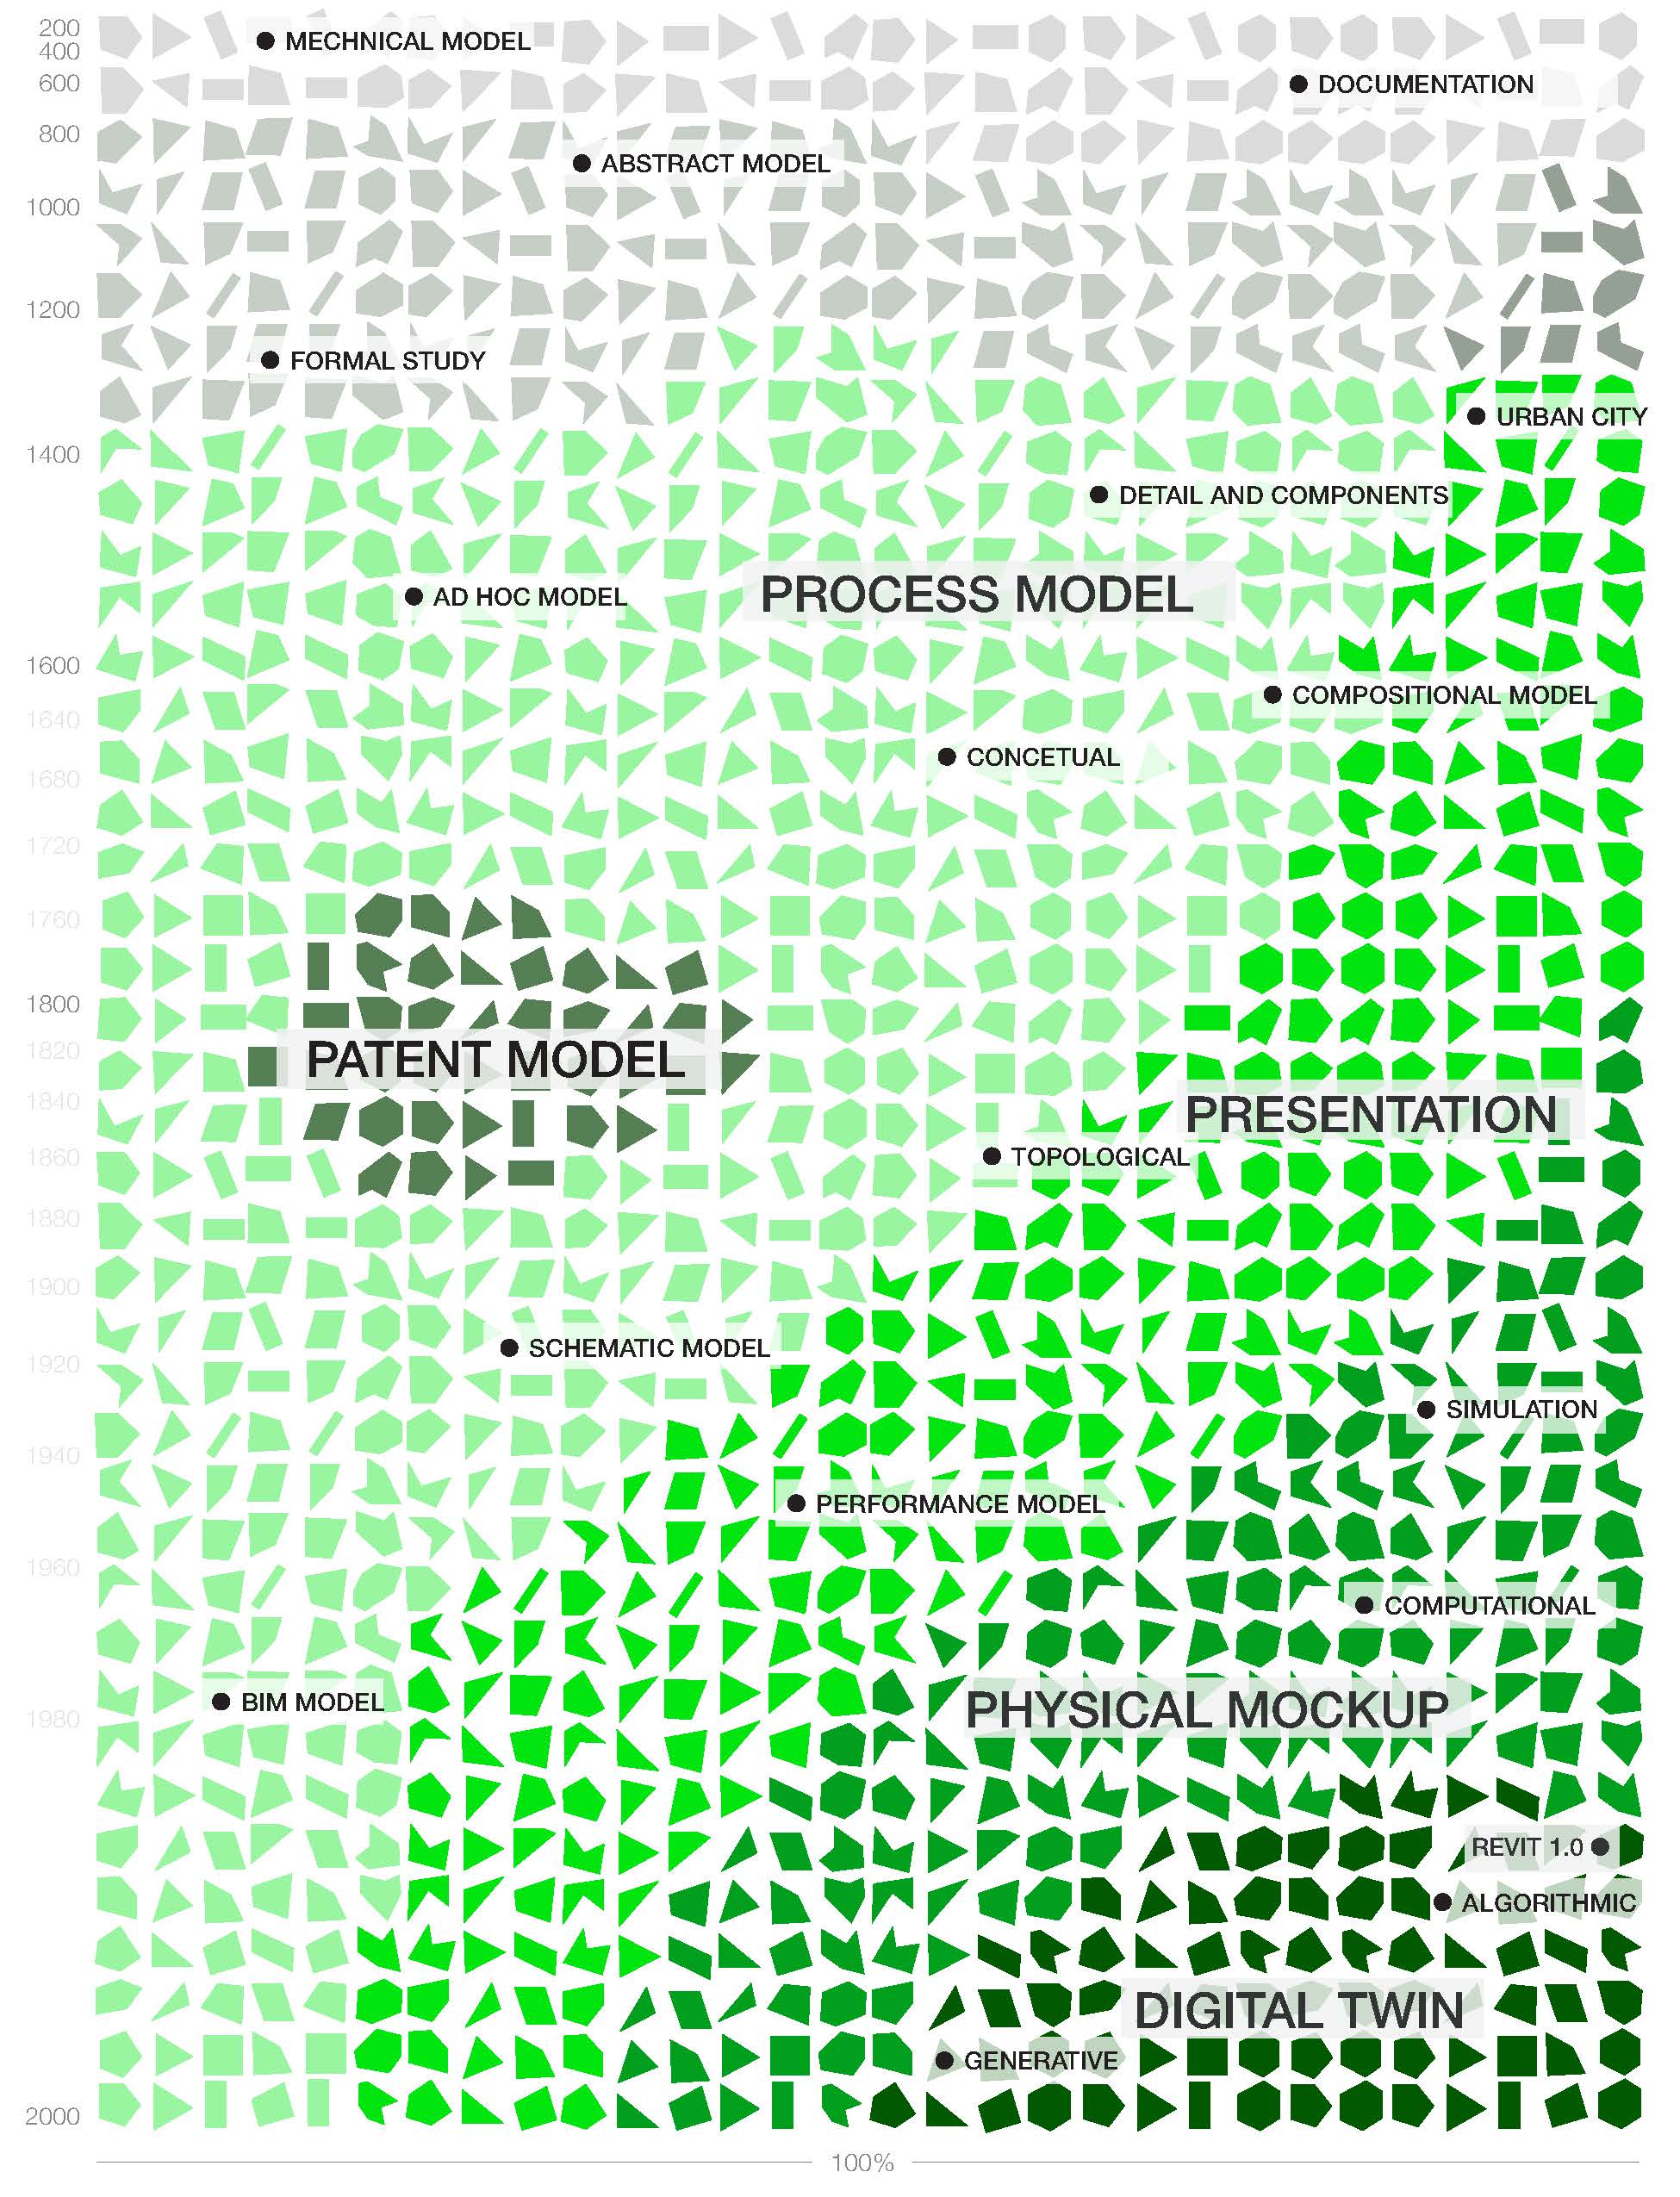
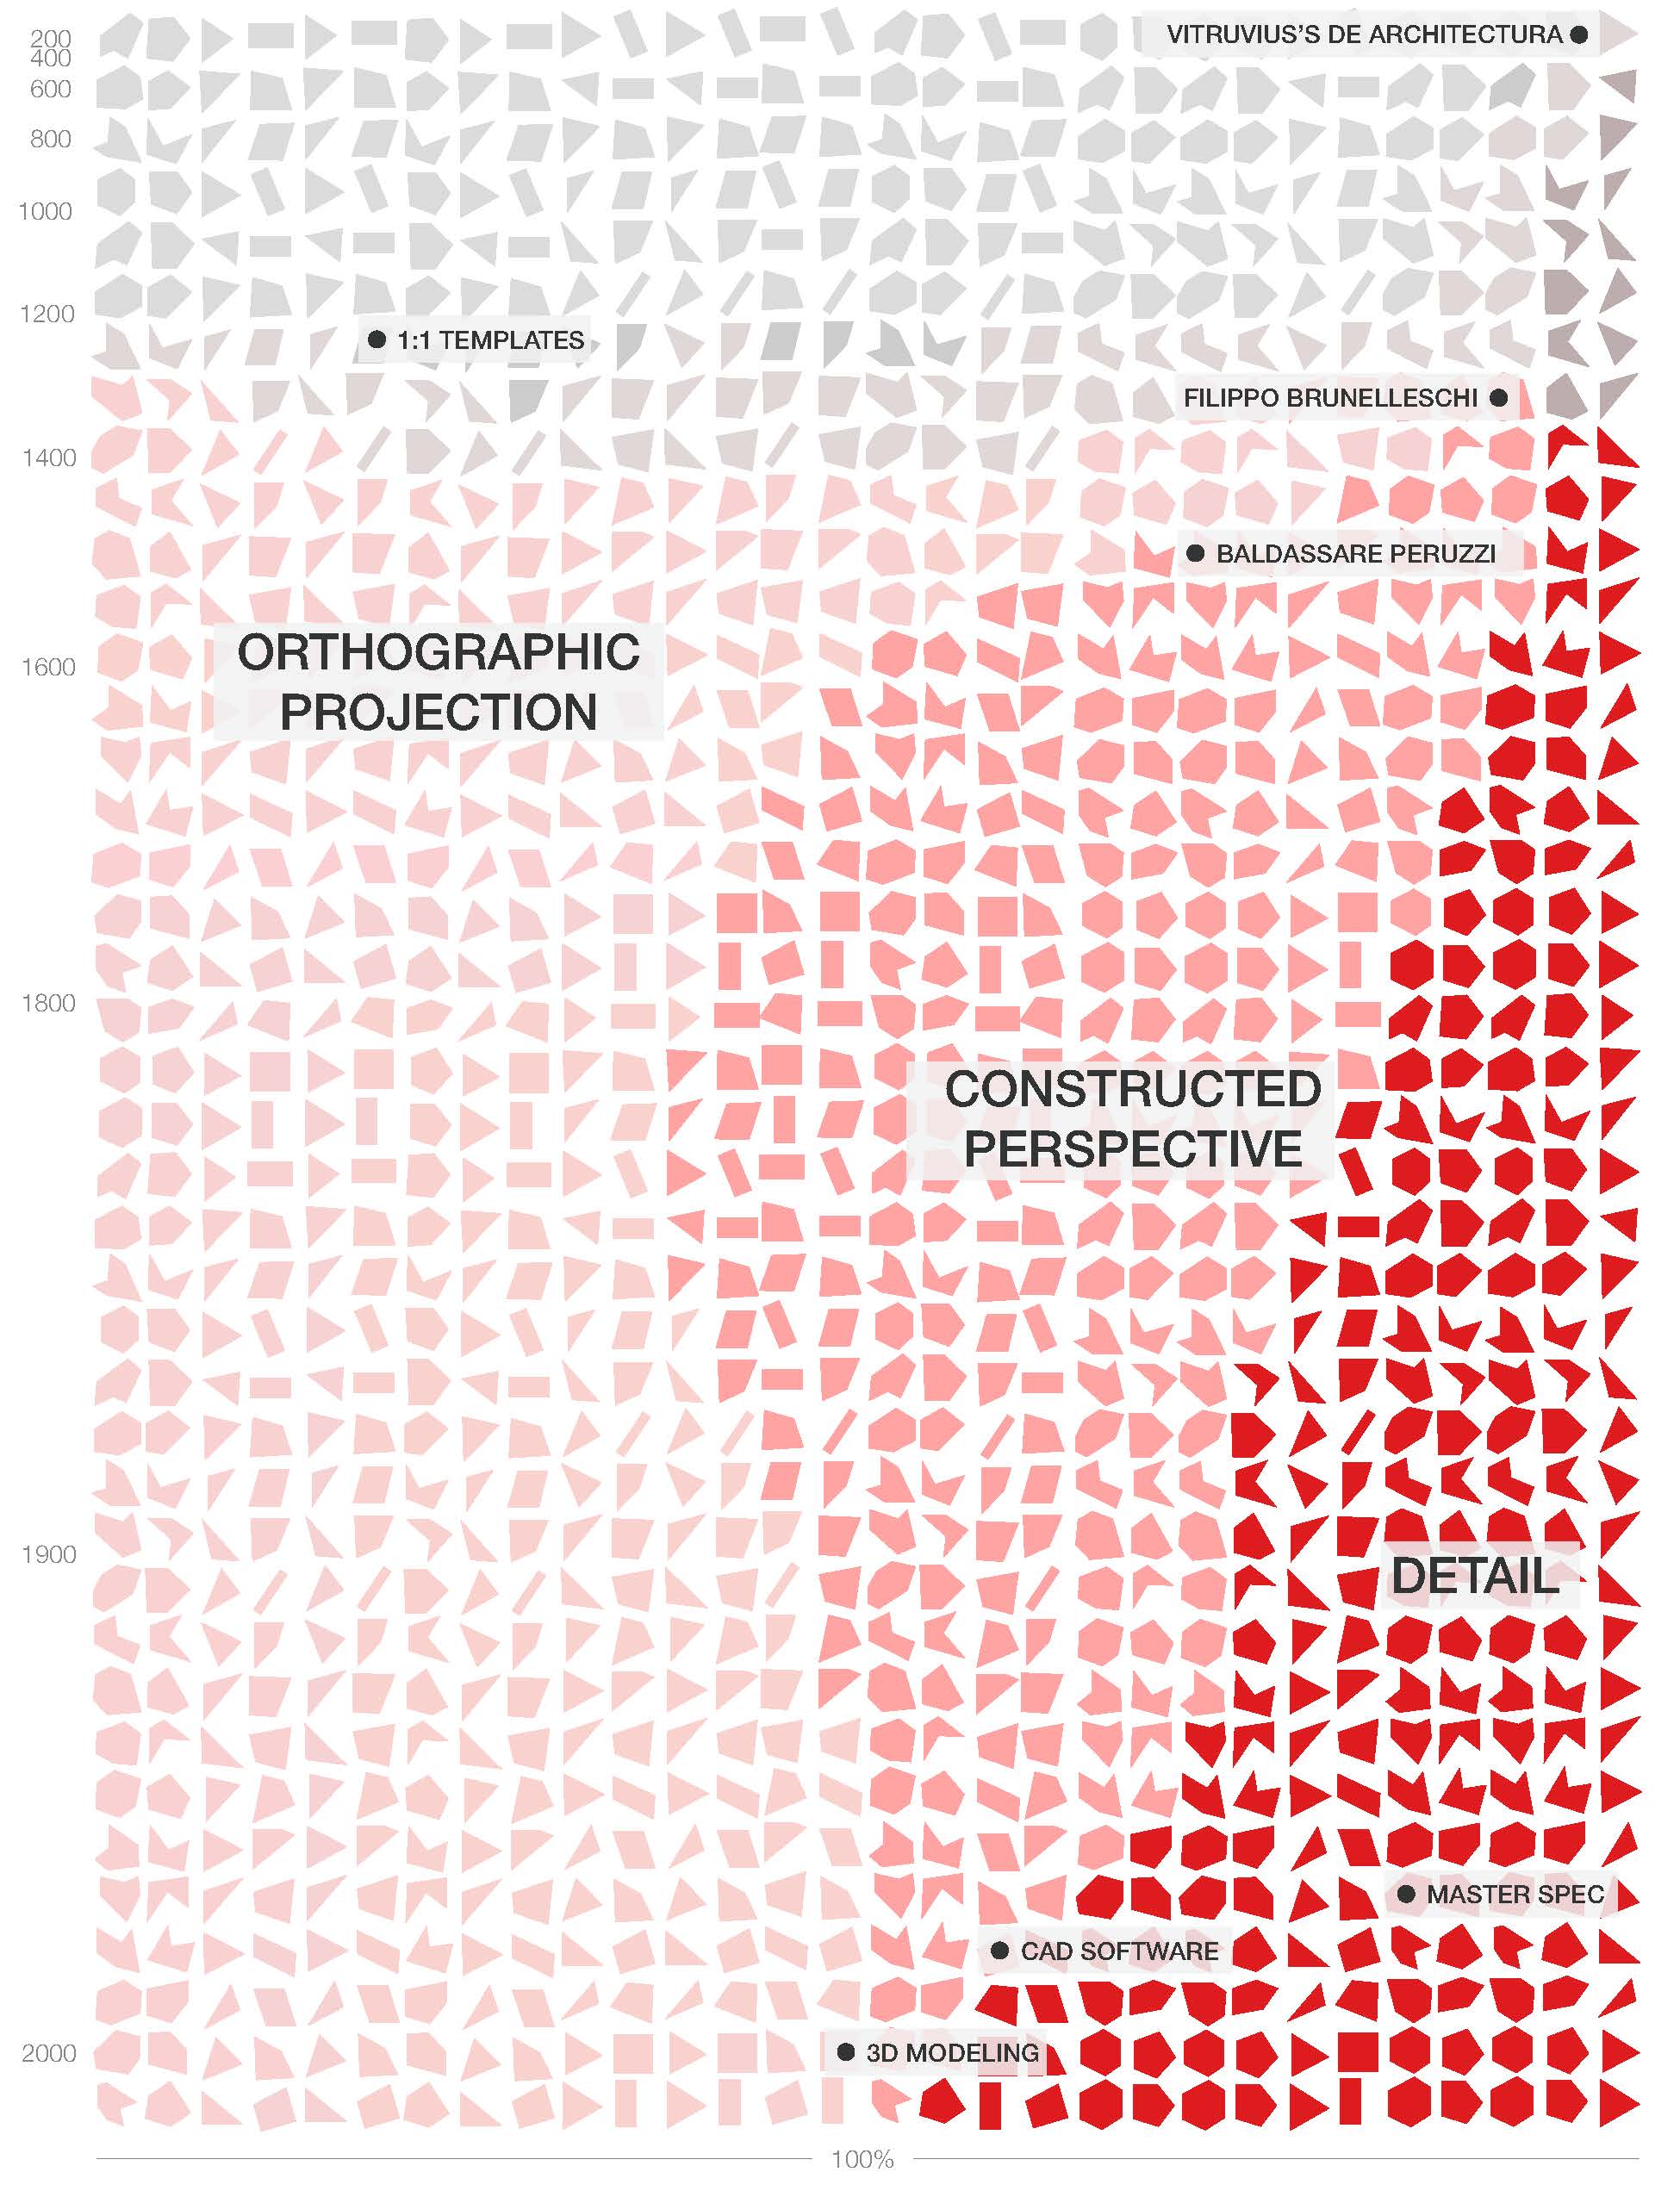
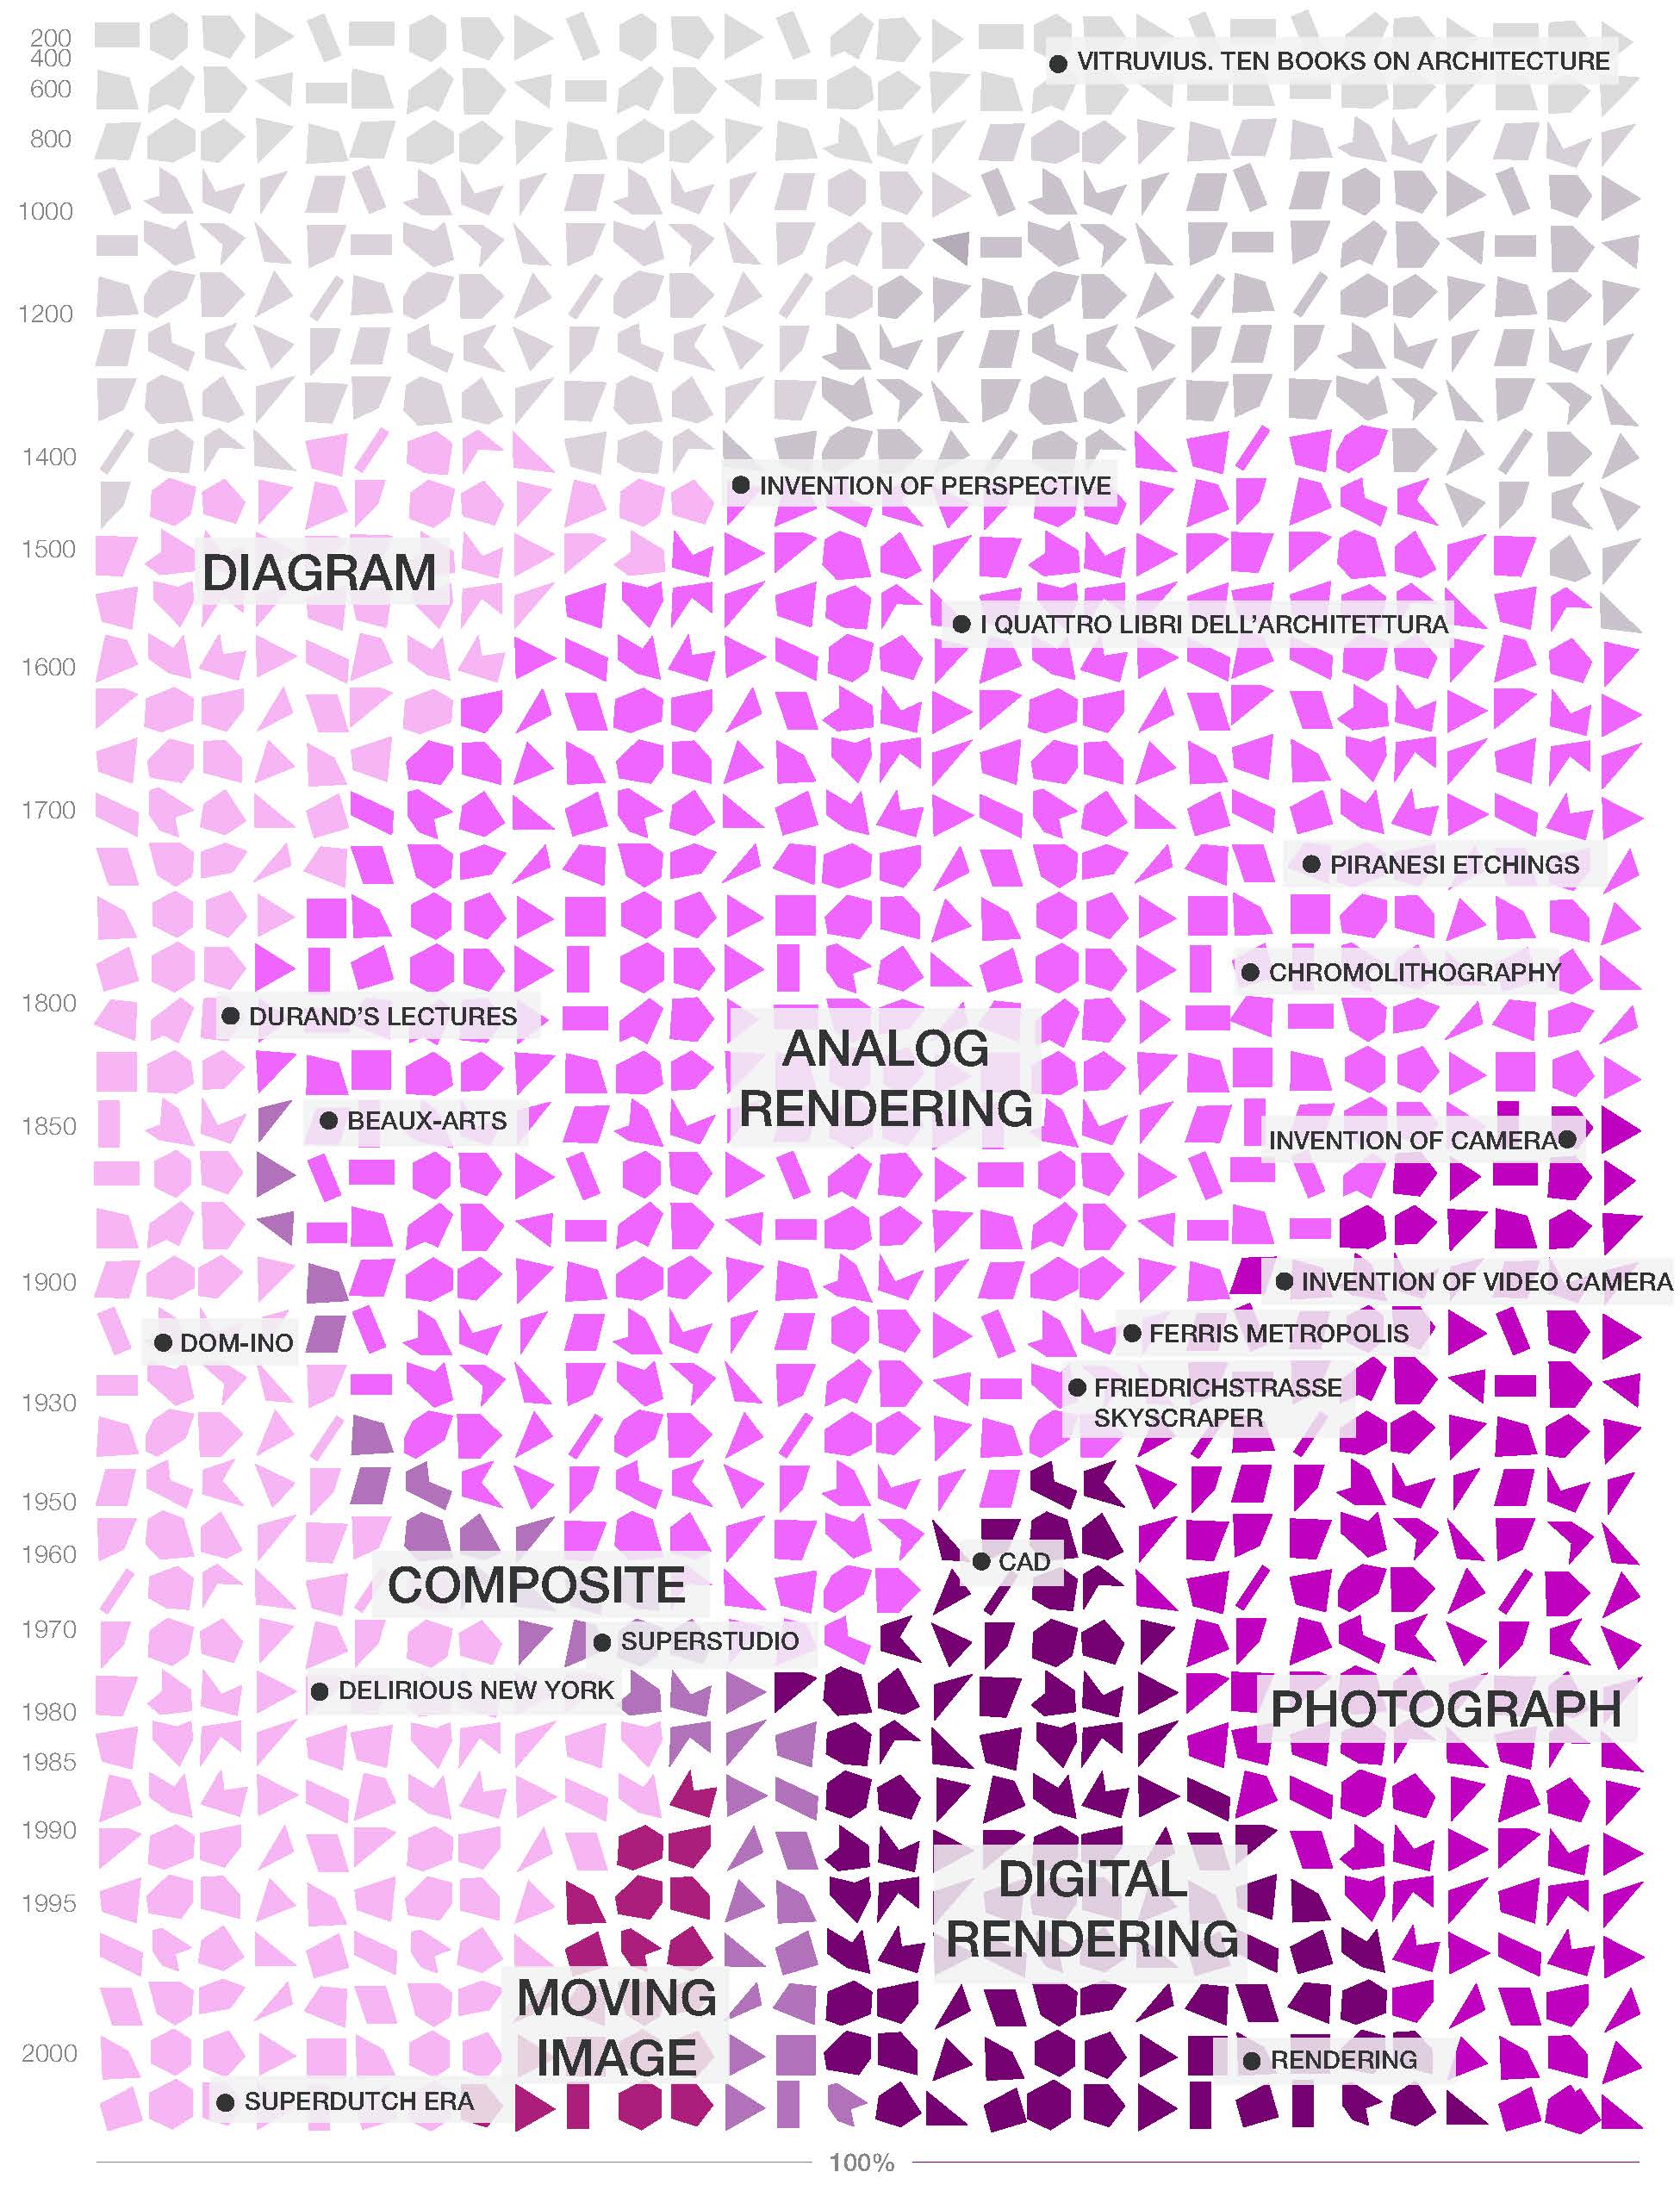

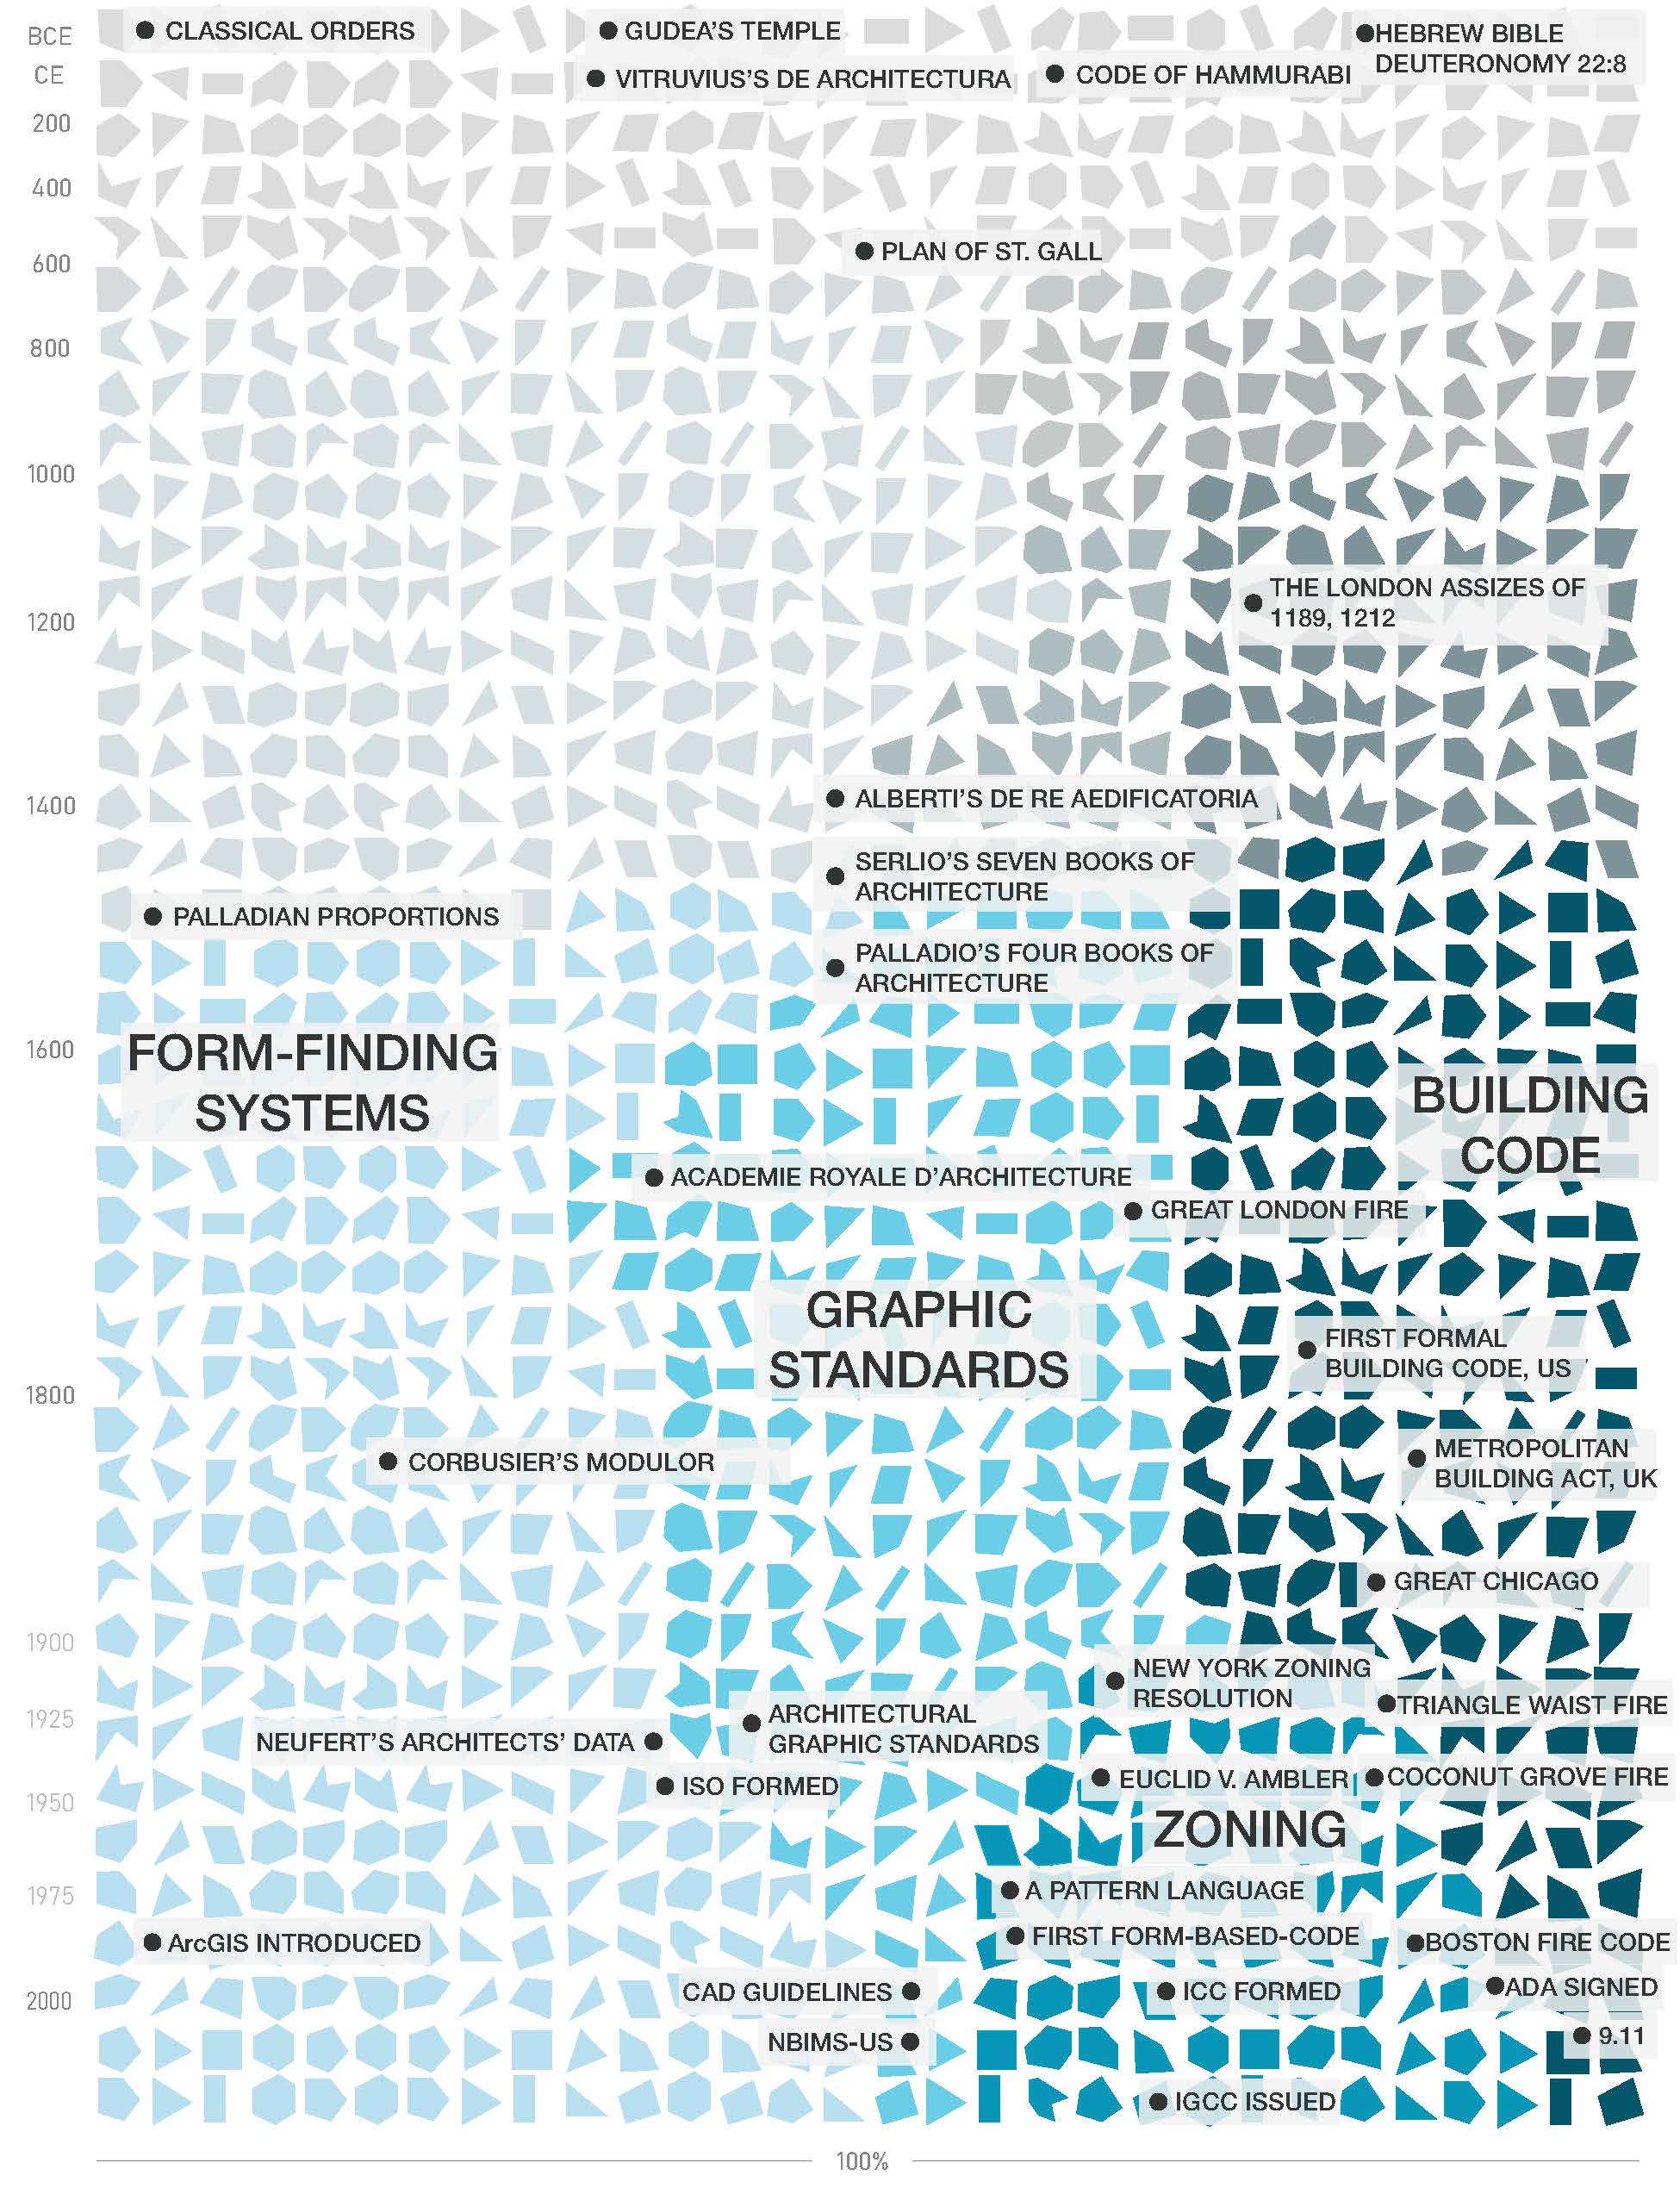
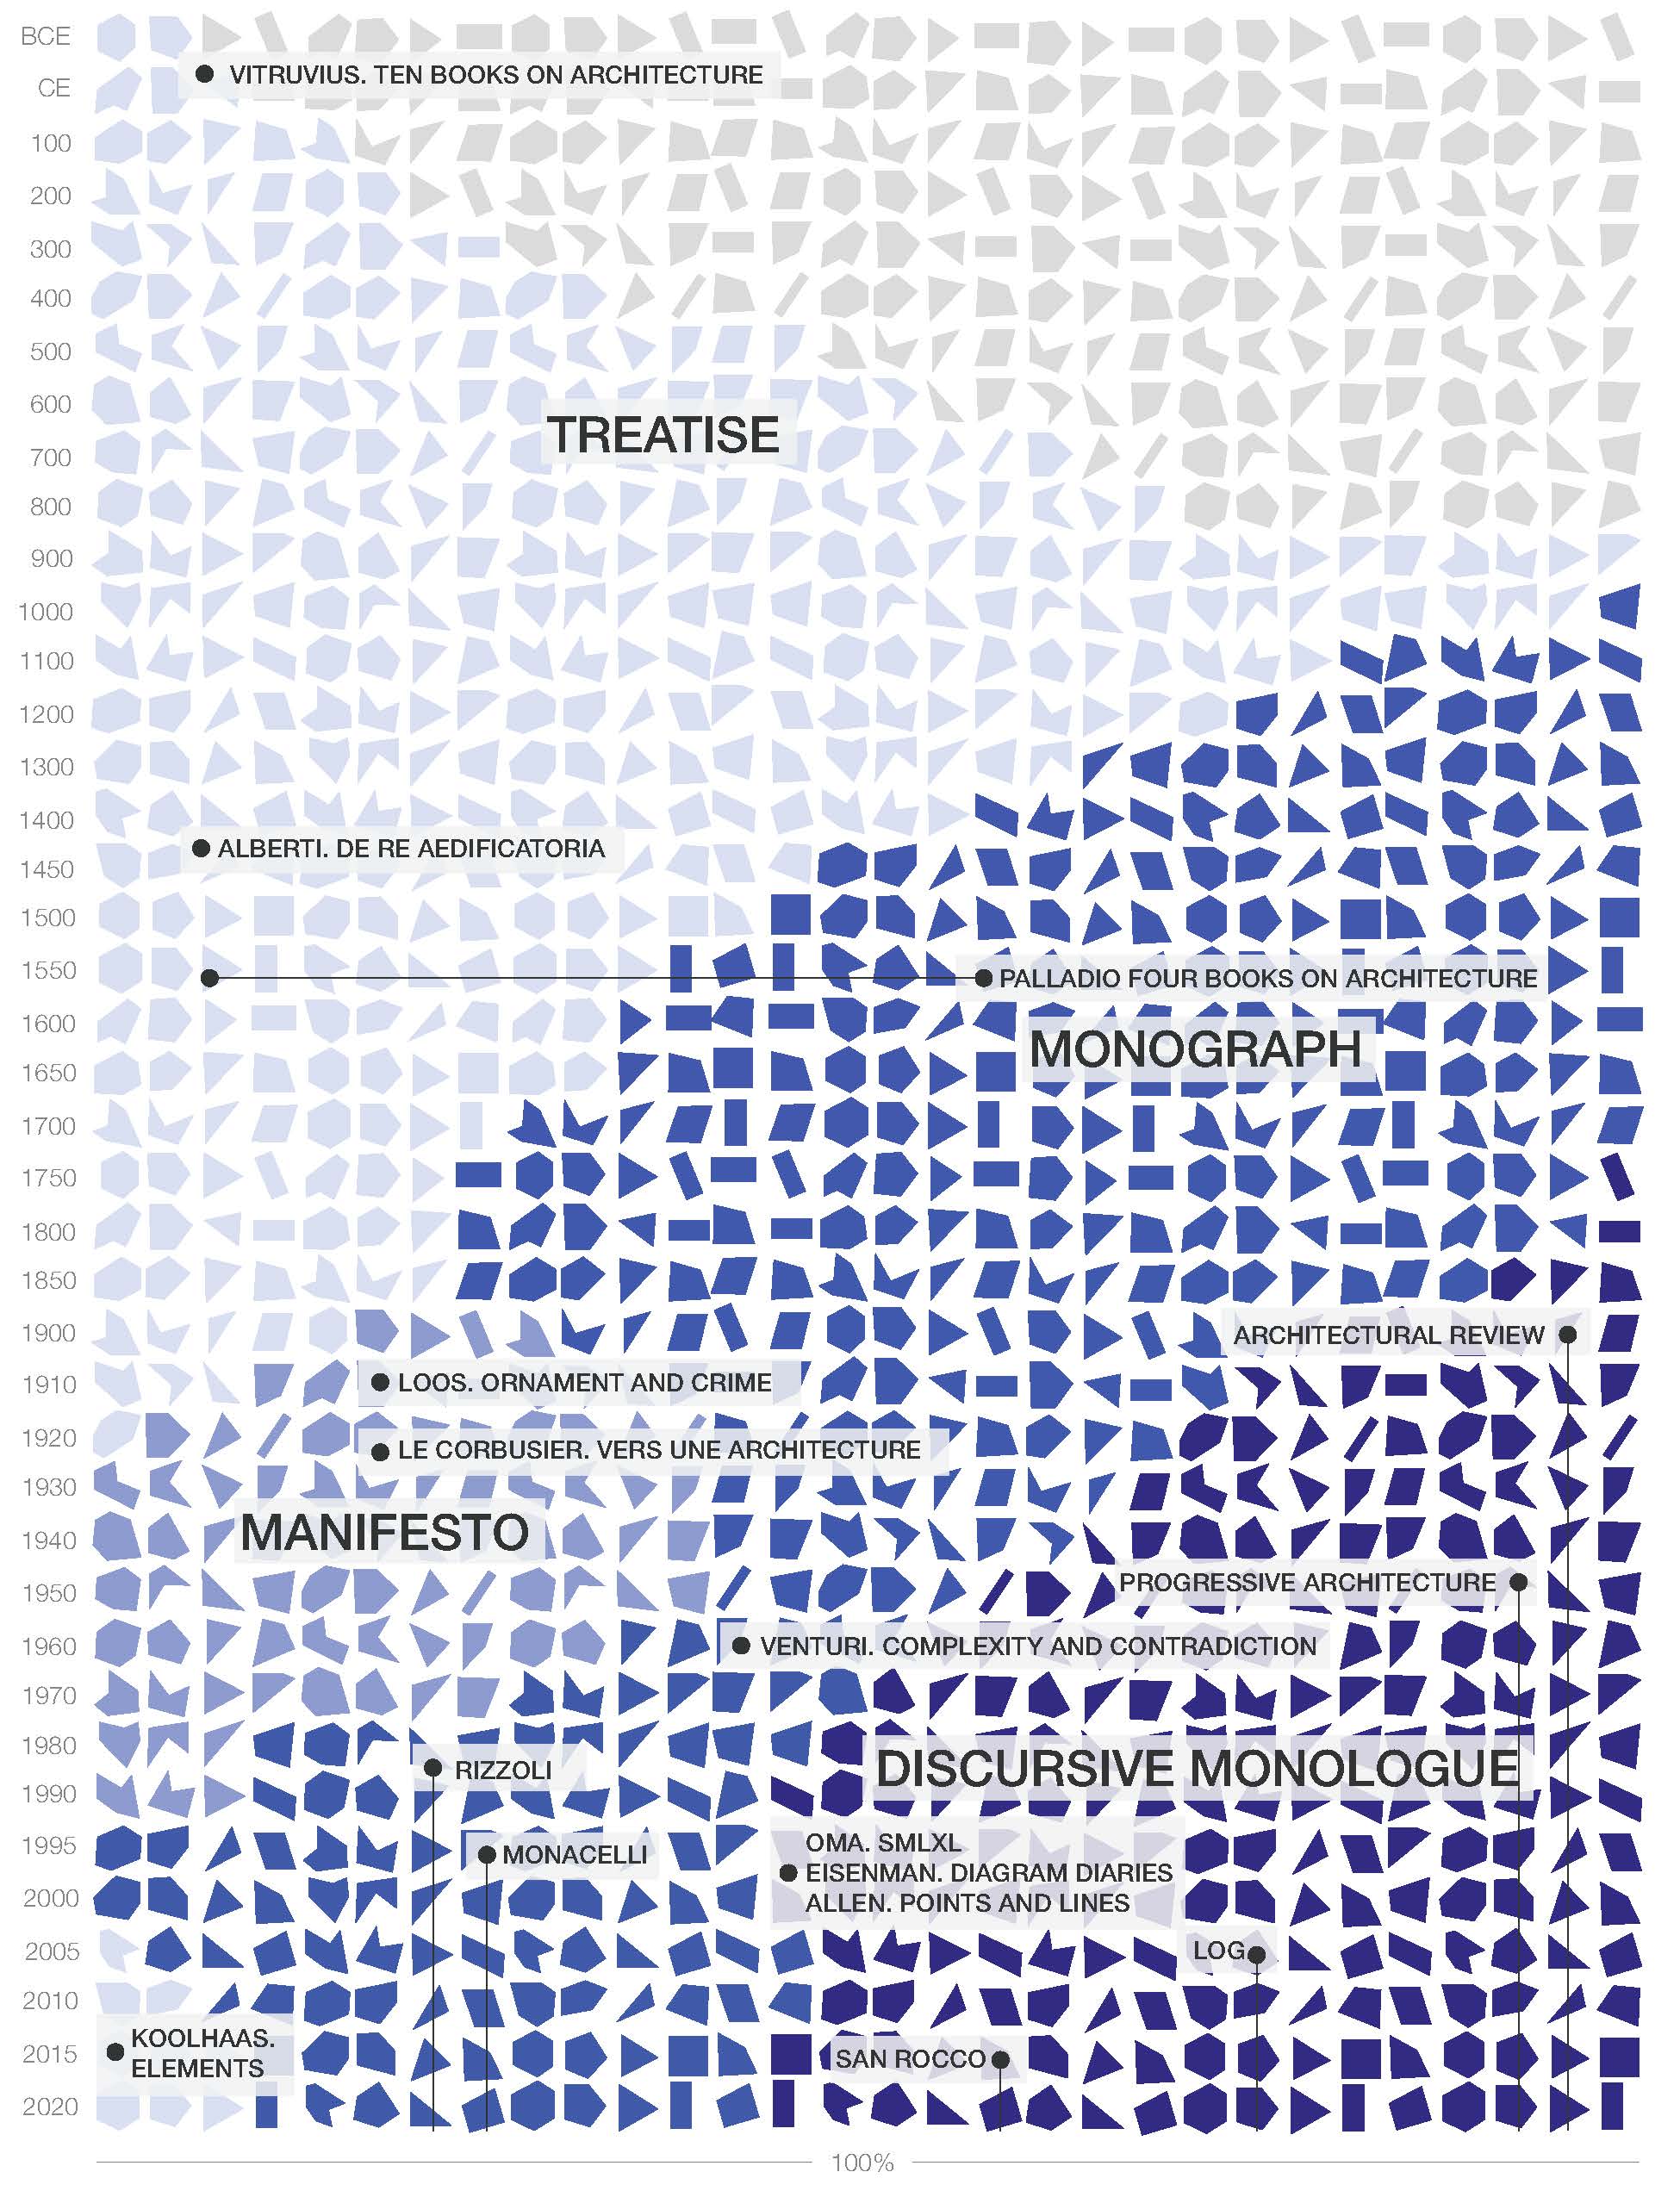
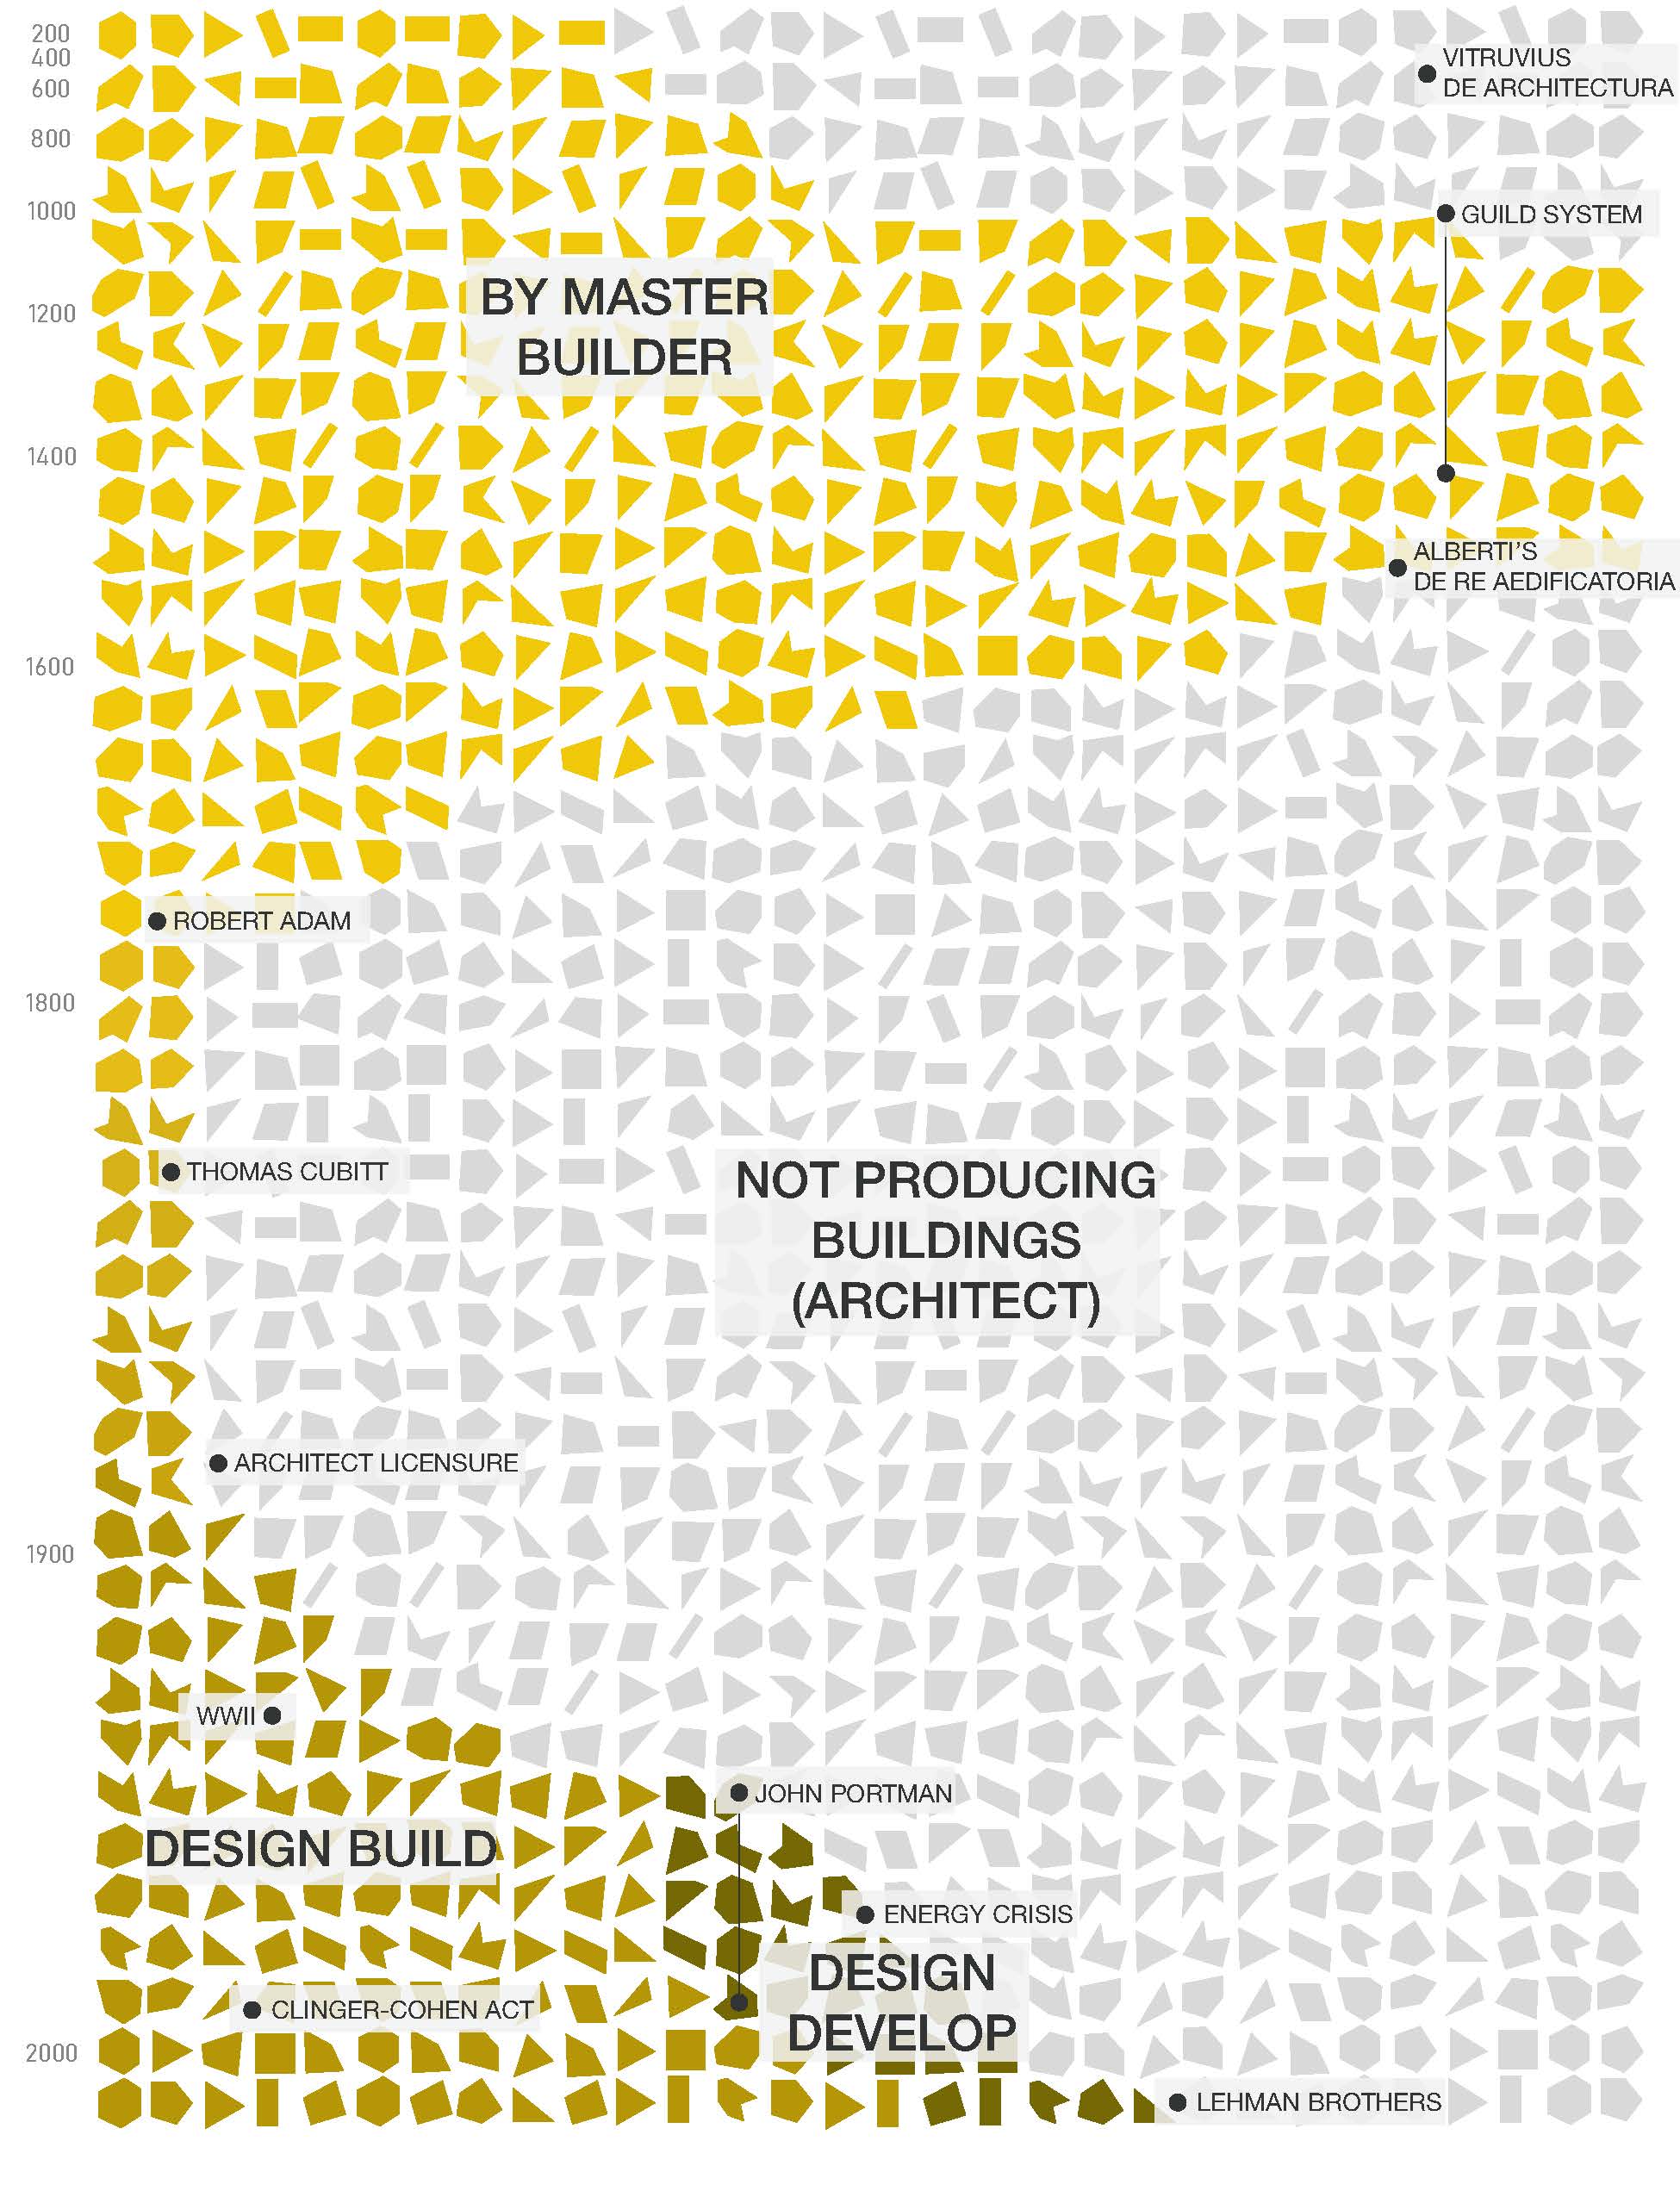
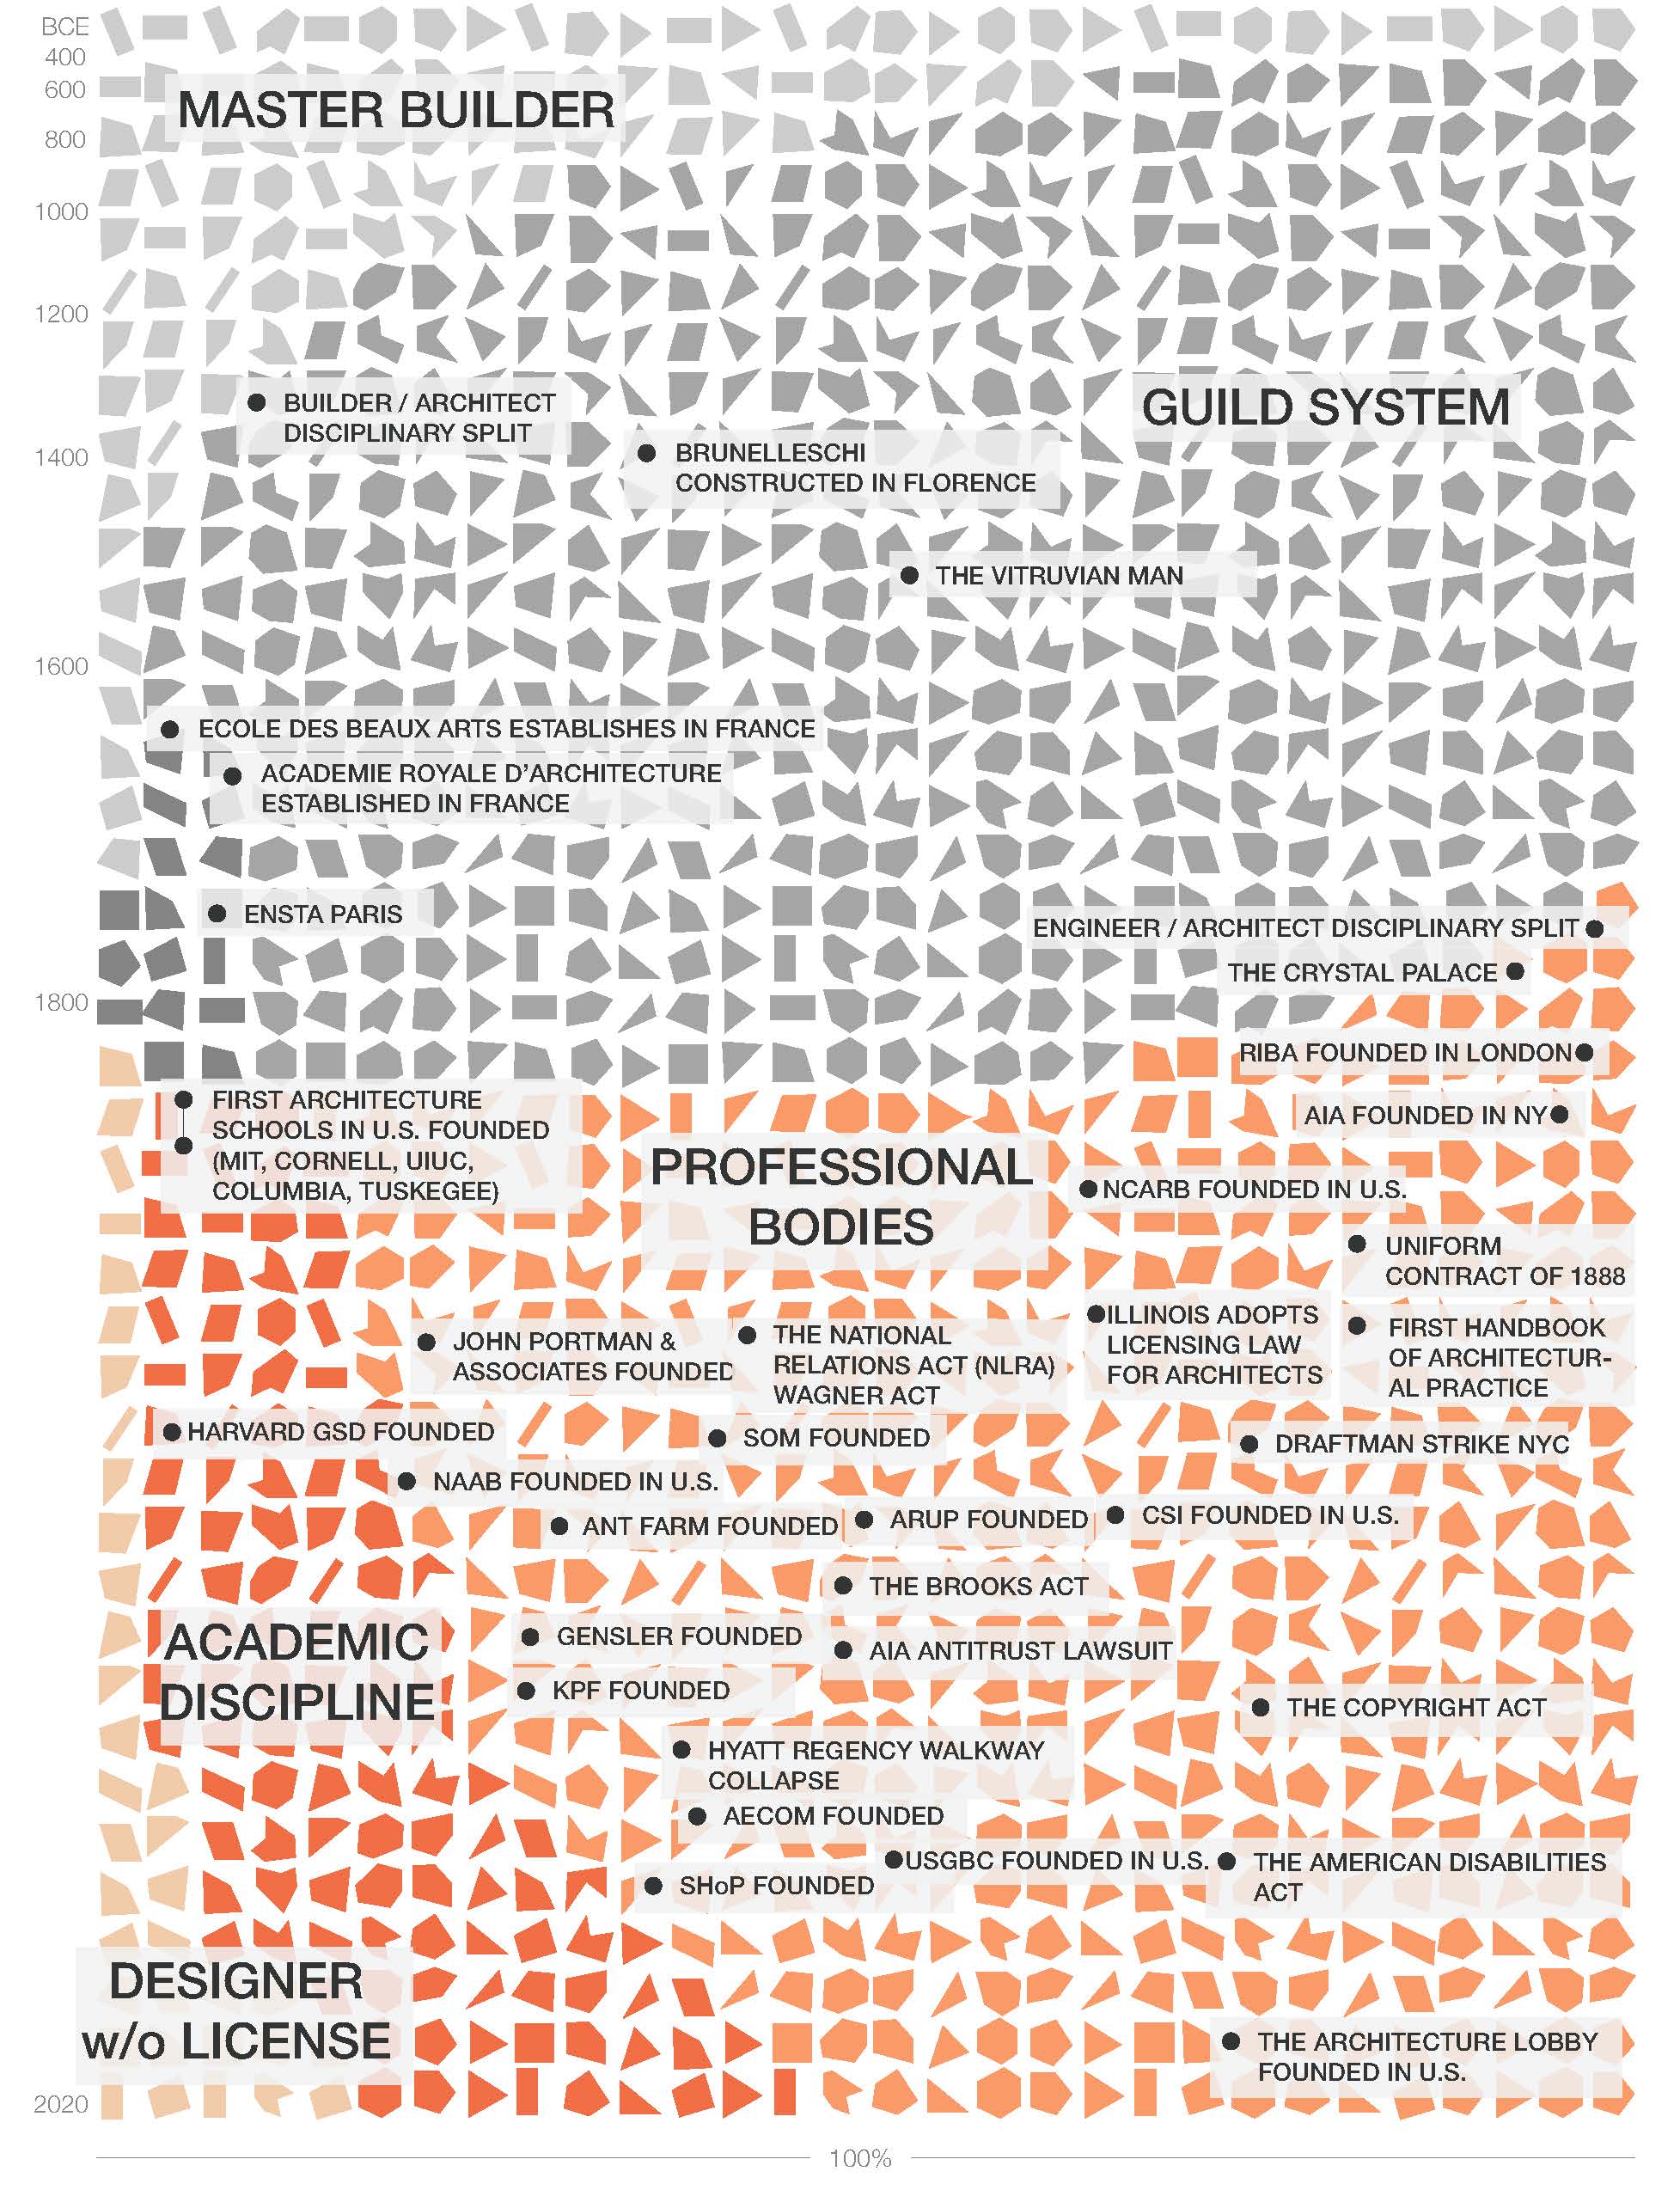
The y-axis of each zero-sum fingerprint visualization tracks time in chronological order while the x-axis hypothesizes the share of influence and dominance of a particular sub-product within the fixed total of the product. For example, text-based instrumentation evolves from the form of the treatise to a more diverse range of monographs, manifestos, and discursive monologues as the discipline and profession mature over time.
There are notable gaps in the data collected by the students, both because there are gaps in historical records and because our work is not complete. This digital humanities project aims to present a facet of architectural culture and knowledge, but does so in a necessarily loose way. As such, the visual language of the fingerprints depicts a kind of blurriness that is more akin to a series of exploratory sketches than a finished work. We welcome your thoughts as we continue to evolve the visualization framework and the unfinished and open-ended story of architectural practice that it portrays.